Profiling an application can be pretty useful. Visualizing it in a meaningful way can be even more helpful. Following the information in this post should get you on the right track to creating useful visualizations of your application like this:
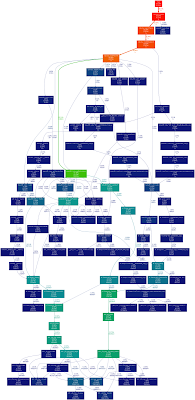
So what does this actually give you?
- A visual representation of how your application is executing
- The percent of execution time spent in each function/method
- Color coding for percentage of execution time
- A function/method call count for each function/method in your application
Great, so what do you need?
- gprof (or another compatible profiler) - This will generate the profile information about your application. Basically, this creates a record of everything your program does during an execution. Check if this is installed by running 'gprof' from a terminal.
- You'll need some supported profiler output. Any of the gcc compilers should support this. For other compilers, check out this link to see if there is some compatibility. Read on to learn how to generate this output with a gcc compiler.
- gprof2Dot.py script - This reads in the profile data created by gprof and a number of other profilers and creates a graph compatible with graphViz. This can be downloaded here.
- GraphViz - GraphViz is a suite of tools for generating graphs. In particular, we need 'dot', which will take the output generated from gprof2Dot and create an image file. Check if this is installed by running 'dot' from a terminal.
Ok, so how do you use it?
There are 3 main steps to getting this to work:
- Build your application with profiling support
- Run your application
- Run gprof, gprof2Dot, and dot on the profile output of your application
Building applications with profiling support is pretty strait-forward. For the gcc compilers, all that's needed is the compiler flag '-pg'. Lets say we have a file testApp.cpp which we want to compile with profiler support. Normally, we'd compile it like this:
- g++ testApp.cpp -o testApp
To get profiling support, we just add the '-pg' flag like so:
- g++ -pg testApp.cpp -o testApp
Assuming it compiles without errors, testApp should now support profiling. Note that for CMake and Makefiles, the '-pg' flag may need to be added to the linker commands as well.
Now that we've added profiling support to the application, we need to run it. Note that the profile output will reflect how the application was run, so if the application is interactive in some way, you'll likely want to run through a use-case that you find interesting.
In the case of our testApp, simply running ./testApp is all we need to do. You'll notice at this point that aside from any other output the application produces, it will also produce a file called gmon.out. This is the profiler information for the run of the application.
gmon.out is a mostly illegible file. We need gprof to interpret it. At this point, you could just use gprof and get some useful information. To do so, you would run the following command:
Where [application name] is the name of the executable you're running. In the case of testApp, we'd run the following command:
This produces a large amount of information about the execution of your application. Everything you need to know is there, but it may be a bit complicated to interpret. That's where visualizing the information comes in.
To visualize the information like the graph above, we need to do some additional work with gprof2Dot and dot. Assuming gprof2Dot.py is in the directory of your application and graphViz is installed, you should be able to run something similar to the following command:
- gprof testApp | ./gprof2dot.py -n 2.5 -e 2.5 -s | dot -Tpng -o output.png
This works by piping the output from gprof into gprof2Top. The output from that is then piped into dot. The end product (in this case) is a png file displaying the call structure of the application. Note that there are several settings here which can be configured:
- -n 2.5 - this sets the minimum execution percentage for a graph node to show up in the graph. In this case, it means that any function that is not using 2.5% or more of the execution time is not displayed.
- -e 2.5 - this is the same as the above, except for edges in the graph.
- -s - this produces simple function names. Without it, the return type and parameter types will be displayed in the resulting graph. This makes for very verbose graph structures, so I've turned it off in the above case.
- -Tpng - This specifies the output file format. dot supports a huge number of formats, so if PNG is not what you're looking for, there are many other options. Make sure to name your output file accordingly.
- -o output.png - this is the output file that dot produces.
Hopefully that's enough to get you started!
